Quick Start
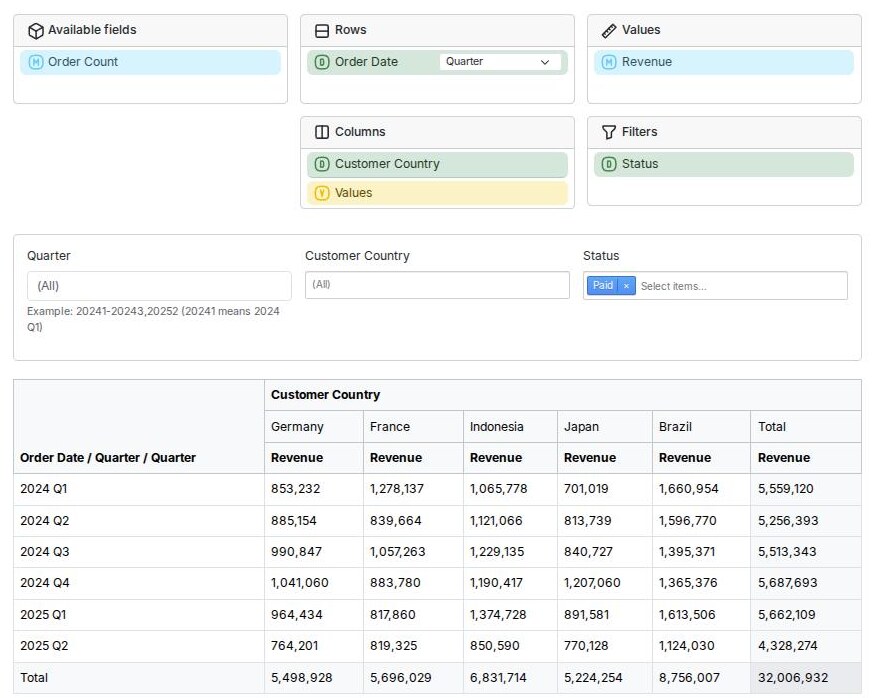
This guide takes an existing Doctrine entity, Order, and adds analytics to
it. At the end, you will have a page with a pivot table that your users can
rearrange by dragging and dropping fields:
Requirements
- PostgreSQL. Other databases are not supported yet.
- A Symfony application using Doctrine ORM and Doctrine Migrations.
- Symfony Messenger with an asynchronous transport that supports delayed messages, like the Doctrine transport.
- AssetMapper and Stimulus, for the user interface.
A new application created using symfony new --webapp has all of these.
The Starting Point
We start with these entities. An Order is placed by a Customer, who lives
in a Country. An order also has a status, and the order amount.
namespace App\Entity;

use Doctrine\DBAL\Types\Types;
use Doctrine\ORM\Mapping as ORM;

#[ORM\Entity()]
#[ORM\Table(name: 'orders')]
class Order
{
    #[ORM\Id]
    #[ORM\GeneratedValue]
    #[ORM\Column]
    private ?int $id = null;

    #[ORM\ManyToOne()]
    #[ORM\JoinColumn(nullable: false)]
    private Customer $customer;

    #[ORM\Column(enumType: OrderStatus::class)]
    private OrderStatus $status = OrderStatus::Pending;

    // the order amount, in cents
    #[ORM\Column]
    private int $amount;

    #[ORM\Column(type: Types::DATETIME_IMMUTABLE)]
    private \DateTimeImmutable $placedAt;

    // constructor, getters, and setters are omitted for brevity
}
namespace App\Entity;

enum OrderStatus: string
{
    case Pending = 'pending';
    case Paid = 'paid';
    case Shipped = 'shipped';
    case Cancelled = 'cancelled';
}
namespace App\Entity;

use Doctrine\ORM\Mapping as ORM;

#[ORM\Entity()]
class Customer
{
    #[ORM\Id]
    #[ORM\GeneratedValue]
    #[ORM\Column]
    private ?int $id = null;

    #[ORM\Column]
    private string $name;

    #[ORM\ManyToOne()]
    #[ORM\JoinColumn(nullable: false)]
    private Country $country;

    // ...
}
namespace App\Entity;

use Doctrine\ORM\Mapping as ORM;

#[ORM\Entity()]
class Country implements \Stringable
{
    #[ORM\Id]
    #[ORM\GeneratedValue]
    #[ORM\Column]
    private ?int $id = null;

    #[ORM\Column]
    private string $name;

    // ...

    public function __toString(): string
    {
        return $this->name;
    }
}
Country implements Stringable, so the user interface knows how to display
it. Alternatively, an object can implement TranslatableInterface, or you can
create your own formatter.
Installation
Install the bundle, the frontend package, and the pivot table panel:
composer require rekalogika/analytics-bundle \
    rekalogika/analytics-frontend \
    rekalogika/analytics-ux-panel
Symfony Flex registers the bundles, adds the Stimulus controllers of the panel
to assets/controllers.json, and adds their JavaScript and CSS dependencies to
importmap.php.
Configuring Messenger
When an order is created, changed, or deleted, the framework refreshes the affected part of the summary table in the background, using Symfony Messenger. Route the refresh message to an asynchronous transport:
framework:
    messenger:
        routing:
            Rekalogika\Analytics\Engine\RefreshAgent\RefreshAgentStartCommand: async
The message must be routed to an asynchronous transport. If it is handled synchronously, the refresh runs in the same process that flushes the orders, and keeps triggering itself, making the flush very slow.
Creating the Summary Entity
A summary entity defines the summary table: which source entity it summarizes, how the data is partitioned, and its dimensions and measures.
namespace App\Entity;

use Doctrine\Common\Collections\Order as SortOrder;
use Doctrine\DBAL\Types\Types;
use Doctrine\ORM\Mapping as ORM;
use Rekalogika\Analytics\Core\AggregateFunction\Count;
use Rekalogika\Analytics\Core\AggregateFunction\Sum;
use Rekalogika\Analytics\Core\Entity\BaseSummary;
use Rekalogika\Analytics\Core\Partition\DefaultIntegerPartition;
use Rekalogika\Analytics\Core\ValueResolver\IdentifierValue;
use Rekalogika\Analytics\Core\ValueResolver\IntegerValue;
use Rekalogika\Analytics\Core\ValueResolver\PropertyValue;
use Rekalogika\Analytics\Metadata\Attribute as Analytics;
use Rekalogika\Analytics\Time\Dimension\System\GregorianDate;
use Rekalogika\Analytics\Time\Metadata\TimeProperties;
use Symfony\Component\Translation\TranslatableMessage;

#[ORM\Entity()]
#[Analytics\Summary(
    sourceClass: Order::class,
    label: new TranslatableMessage('Orders'),
)]
class OrderSummary extends BaseSummary
{
    //
    // partition
    //

    #[ORM\Embedded()]
    #[Analytics\Partition(new IntegerValue('id'))]
    private DefaultIntegerPartition $partition;

    //
    // dimensions
    //

    #[ORM\Embedded()]
    #[Analytics\Dimension(
        source: new PropertyValue('placedAt'),
        label: new TranslatableMessage('Order Date'),
        orderBy: SortOrder::Ascending,
    )]
    #[TimeProperties(
        sourceTimeZone: new \DateTimeZone('UTC'),
        summaryTimeZone: new \DateTimeZone('Europe/Berlin'),
    )]
    private GregorianDate $placedAt;

    #[ORM\ManyToOne()]
    #[Analytics\Dimension(
        source: new IdentifierValue('customer.country'),
        label: new TranslatableMessage('Customer Country'),
    )]
    private ?Country $customerCountry = null;

    #[ORM\Column(enumType: OrderStatus::class, nullable: true)]
    #[Analytics\Dimension(
        source: new PropertyValue('status'),
        label: new TranslatableMessage('Status'),
    )]
    private ?OrderStatus $status = null;

    //
    // measures
    //

    #[ORM\Column(type: Types::BIGINT, nullable: true)]
    #[Analytics\Measure(
        function: new Sum('amount'),
        label: new TranslatableMessage('Revenue'),
    )]
    private ?int $revenue = null;

    #[ORM\Column(type: Types::INTEGER, nullable: true)]
    #[Analytics\Measure(
        function: new Count('id'),
        label: new TranslatableMessage('Order Count'),
    )]
    private ?int $count = null;

    //
    // getters
    //

    public function getPlacedAt(): GregorianDate
    {
        return $this->placedAt;
    }

    public function getCustomerCountry(): ?Country
    {
        return $this->customerCountry;
    }

    public function getStatus(): ?OrderStatus
    {
        return $this->status;
    }

    public function getRevenue(): ?int
    {
        return $this->revenue;
    }

    public function getCount(): ?int
    {
        return $this->count;
    }
}
- Partition. The summary table is divided into partitions by the ID of the
orders. When an order changes, only its partition is recalculated.
DefaultIntegerPartitionis suitable for auto-incrementing integer IDs. See partitioning. - Dimensions. The properties you group and filter by.
placedAtusesGregorianDate, a ready-made dimension group that breaks down the order time into year, quarter, month, date, and more.customerCountryfollows the relation fromOrdertoCustomertoCountry. See dimensions and time dimensions. - Measures. The aggregated values: the sum of the order amounts, and the number of orders. See measures.
- Getters. The framework reads the values of the summary using getters, so every dimension and measure needs one.
To check how the framework understands your summary entity, run:
php bin/console rekalogika:analytics:debug:summary 'App\Entity\OrderSummary'
Creating the Database Schema
Generate a migration for the summary table, and the tables that the framework uses to track changes:
php bin/console doctrine:migrations:diff --namespace='App\Migrations'
php bin/console doctrine:migrations:migrate
The bundle comes with its own migrations, which create the SQL functions it
needs. Because of that, there is more than one migration namespace, and you
need to tell doctrine:migrations:diff to use your own. Use the namespace
specified in config/packages/doctrine_migrations.yaml, which might be
DoctrineMigrations in older applications.
Populating the Summary Table
The summary table is initially empty. Summarize the existing orders:
php bin/console rekalogika:analytics:refresh:range 'App\Entity\OrderSummary'
From now on, the summary table is updated automatically when orders are created, changed, or deleted. Make sure a worker is consuming the messages:
php bin/console messenger:consume async
The updates are debounced, so changes appear in the summary within 30 minutes by default. See Refreshing to adjust this.
Creating the Pivot Table Page
The controller creates a query from the state of the panel, which the browser
passes in the URL as a JSON-encoded parameters query parameter. Then, it
renders the result as a pivot table.
namespace App\Controller;

use App\Entity\OrderSummary;
use Rekalogika\Analytics\Contracts\SummaryManager;
use Rekalogika\Analytics\Frontend\Html\TableRenderer;
use Rekalogika\Analytics\UX\PanelBundle\PivotAwareQueryFactory;
use Symfony\Bundle\FrameworkBundle\Controller\AbstractController;
use Symfony\Component\HttpFoundation\Response;
use Symfony\Component\HttpKernel\Attribute\MapQueryParameter;
use Symfony\Component\Routing\Attribute\Route;

final class OrderAnalyticsController extends AbstractController
{
    #[Route('/analytics/orders', name: 'analytics_orders')]
    public function index(
        SummaryManager $summaryManager,
        PivotAwareQueryFactory $pivotAwareQueryFactory,
        TableRenderer $tableRenderer,
        #[MapQueryParameter] ?string $parameters = null,
    ): Response {
        // the state of the pivot table panel, encoded in the URL as JSON
        $parameters = json_decode($parameters ?? '', true);

        if (!\is_array($parameters)) {
            $parameters = [];
        }

        $query = $pivotAwareQueryFactory->createFromParameters(
            query: $summaryManager->createQuery()->from(OrderSummary::class),
            parameters: $parameters,
        );

        $pivotTable = $tableRenderer->renderPivotTable(
            cube: $query->getResult(),
            rows: $query->getRows(),
            columns: $query->getColumns(),
            measures: $query->getValues(),
        );

        return $this->render('analytics/orders.html.twig', [
            'query' => $query,
            'pivotTable' => $pivotTable,
        ]);
    }
}
In the template, analytics_render_control() renders the panel. When the user
changes the panel, it fetches the page again with the new parameters, and puts
the new pivot table in the element specified by target.
{% extends 'base.html.twig' %}

{% block title %}Orders{% endblock %}

{% block stylesheets %}
    {{ parent() }}
    <link rel="stylesheet" href="https://cdn.jsdelivr.net/npm/bootstrap@5.3.8/dist/css/bootstrap.min.css">
{% endblock %}

{% block body %}
    <div class="container my-5">
        {{ analytics_render_control(
            query: query,
            output: pivotTable,
            target: 'pivot-table',
            urlParameter: 'parameters',
        ) }}

        <div id="pivot-table" class="mt-4"></div>
    </div>
{% endblock %}
The panel is styled using Bootstrap 5. Remove the stylesheet above if your application already uses Bootstrap. To render the pivot table using Bootstrap too, change the table theme:
rekalogika_analytics:
    table_theme: "@RekalogikaAnalyticsFrontend/bootstrap_5_renderer.html.twig"
Trying It Out
Open /analytics/orders in your browser. Initially, the pivot table is empty.
To populate it:
- Drag Order Date to Rows, and choose the level of detail, for example Quarter.
- Drag Customer Country to Columns.
- Drag Revenue to Values.
- Drag Status to Filters, and select the statuses to include.
Every dimension in Rows, Columns, or Filters also gets a filter control below the panel. The state of the panel is kept in the URL, so you can bookmark or share it.
Next Steps
- Querying the summary from your own code.
- Rendering the result as a chart or a spreadsheet.
- Formatting the values, for example to display the revenue as money instead of cents.
- Choosing which grouping sets are stored, when the summary has many dimensions.